Rabbelhjälpen (svenska) - Lös Rabbel ett ord i taget om du fastnat. (beta) New
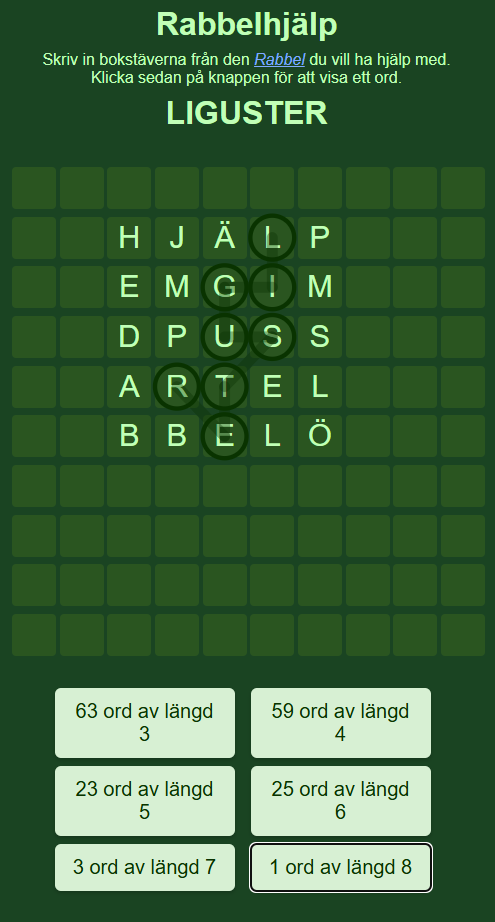
Hjälp för det roliga ordspelet Rabbel. Ibland sitter man fast och är villig att vara omoralisk nog att ta hjälp. Här kan man få fram ett ord så att man kommer vidare. Gå till Rabbelhjälpen som löser ut ett ord i taget.
Dynamic population density map for everywhere in Sweden (beta) New
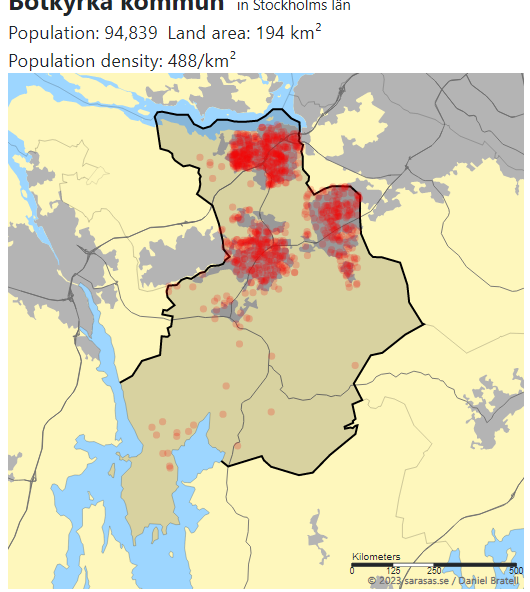
Population density plotted using a stochastic algorithm where the official population density decides the probability function. Based on OpenStreetmap's region borders and lake data, SCB's town definitions, Trafikverket's road data, and EEA's coastlines and Lantmäteriet's height data-->.
With zooming, panning, and easy navigation.
Population density in Sweden
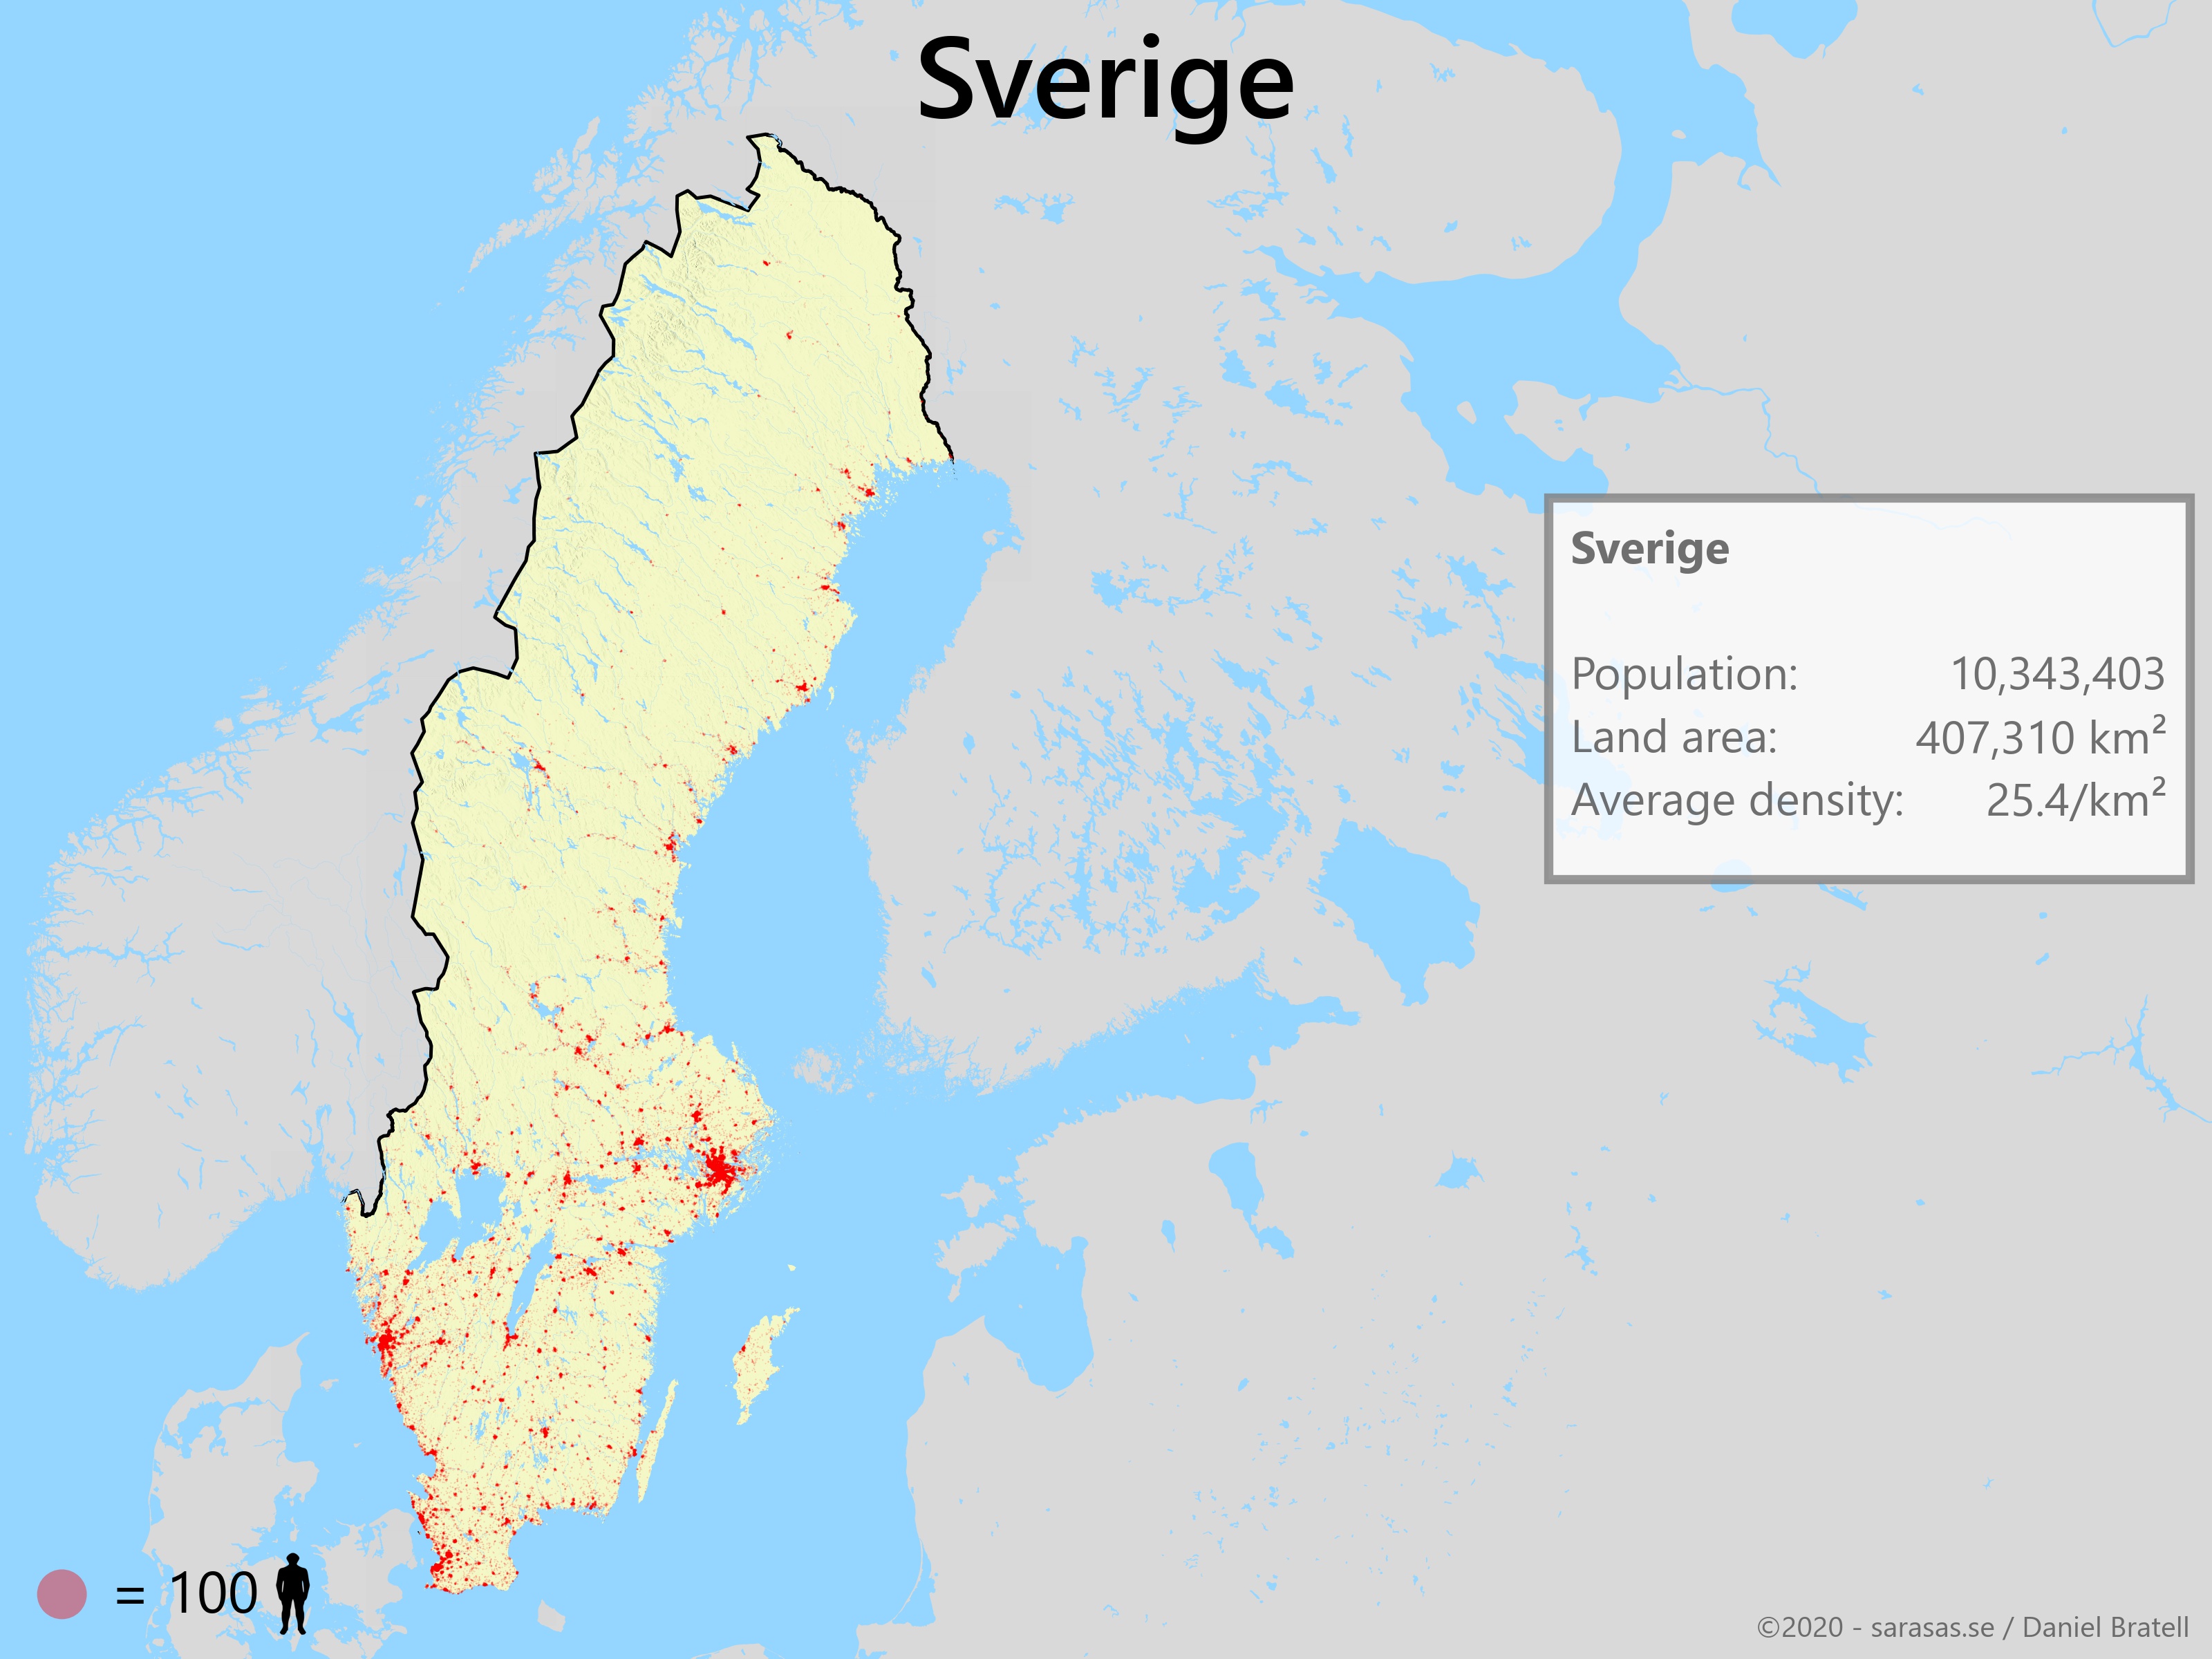
Population density plotted using a stochastic algorithm where the official population density decides the probability function. Based on OpenStreetmap's region borders and lake data, SCB's town definitions, Trafikverket's road data, SMHI's waterways, EEA's coastlines and Lantmäteriet's height data.
This map high resolution image covers all of Sweden. For more local maps, see below.
Population density in Swedish counties (län)
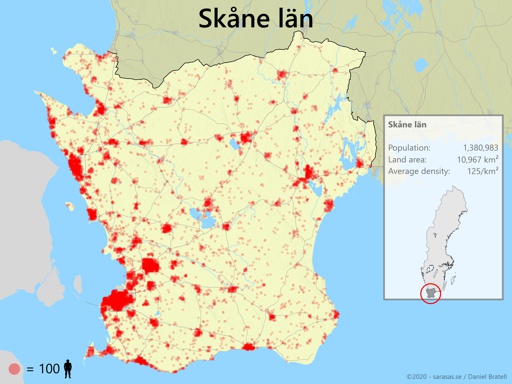
Population density plotted for each of the 21 Swedish counties using the same techniques and sources as for the Swedish map above.
Population density in Swedish municipalities (kommun)
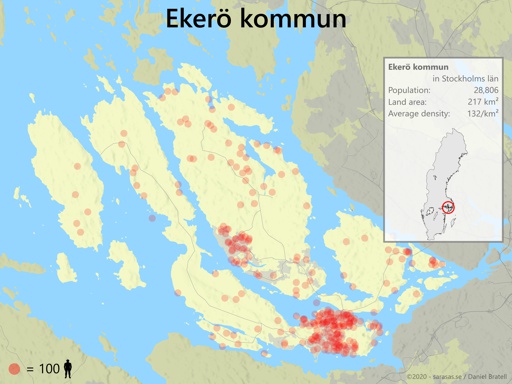
Population density plotted for each of the 290 Swedish municipalities using the same techniques and sources as for the Swedish map above.
Visualization of pandemic deaths in Sweden
Showing how COVID-19 struck Sweden March to June giving each victim their own localized symbol.
Measure rhythm or mouse click speed
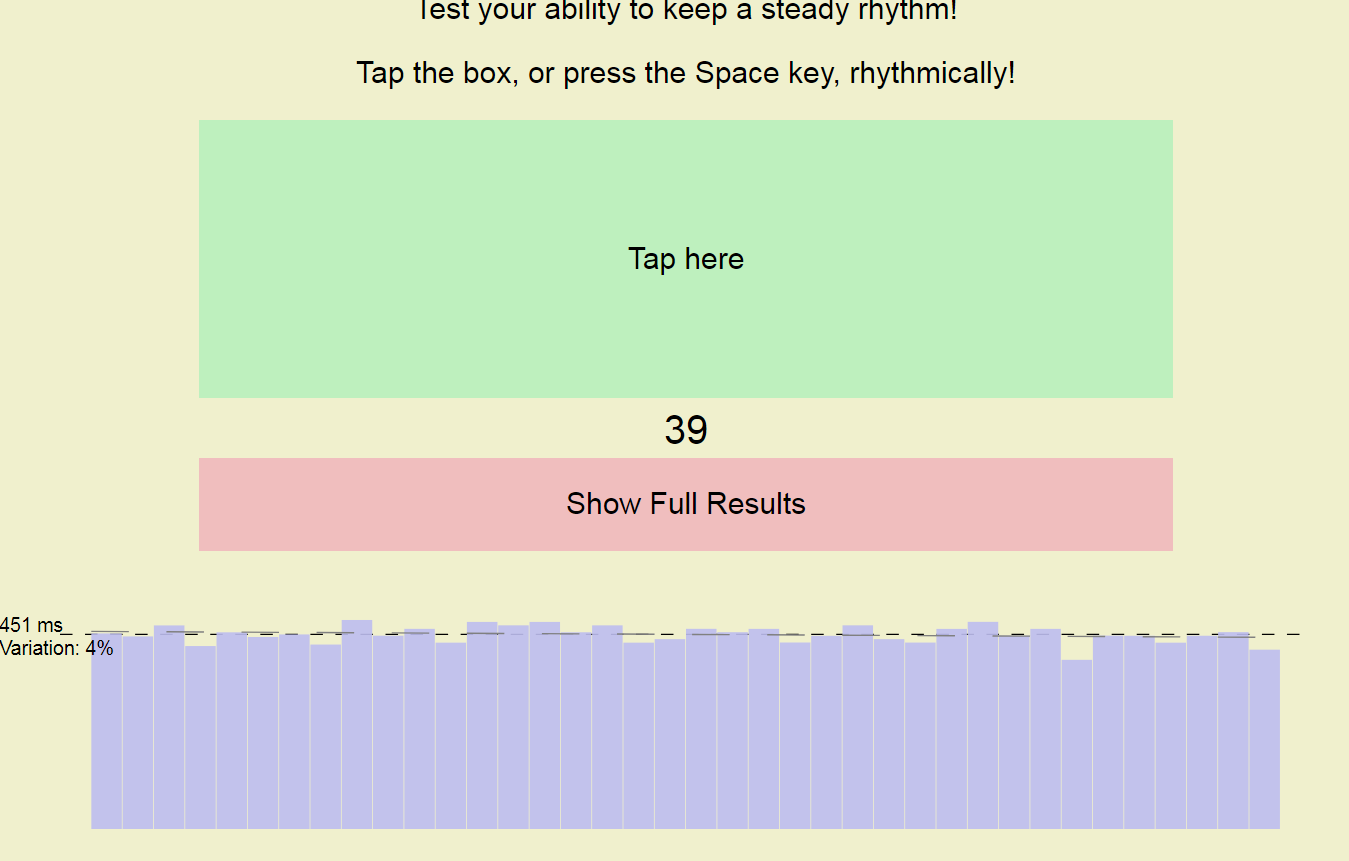
Easy to use web application which lets you keep a rythm either by tapping the phone or using a mouse. It tells you how well you did. Share with friends and see who are best at keeping a rythm!
Can also be used to see who can tap or click the fastest.
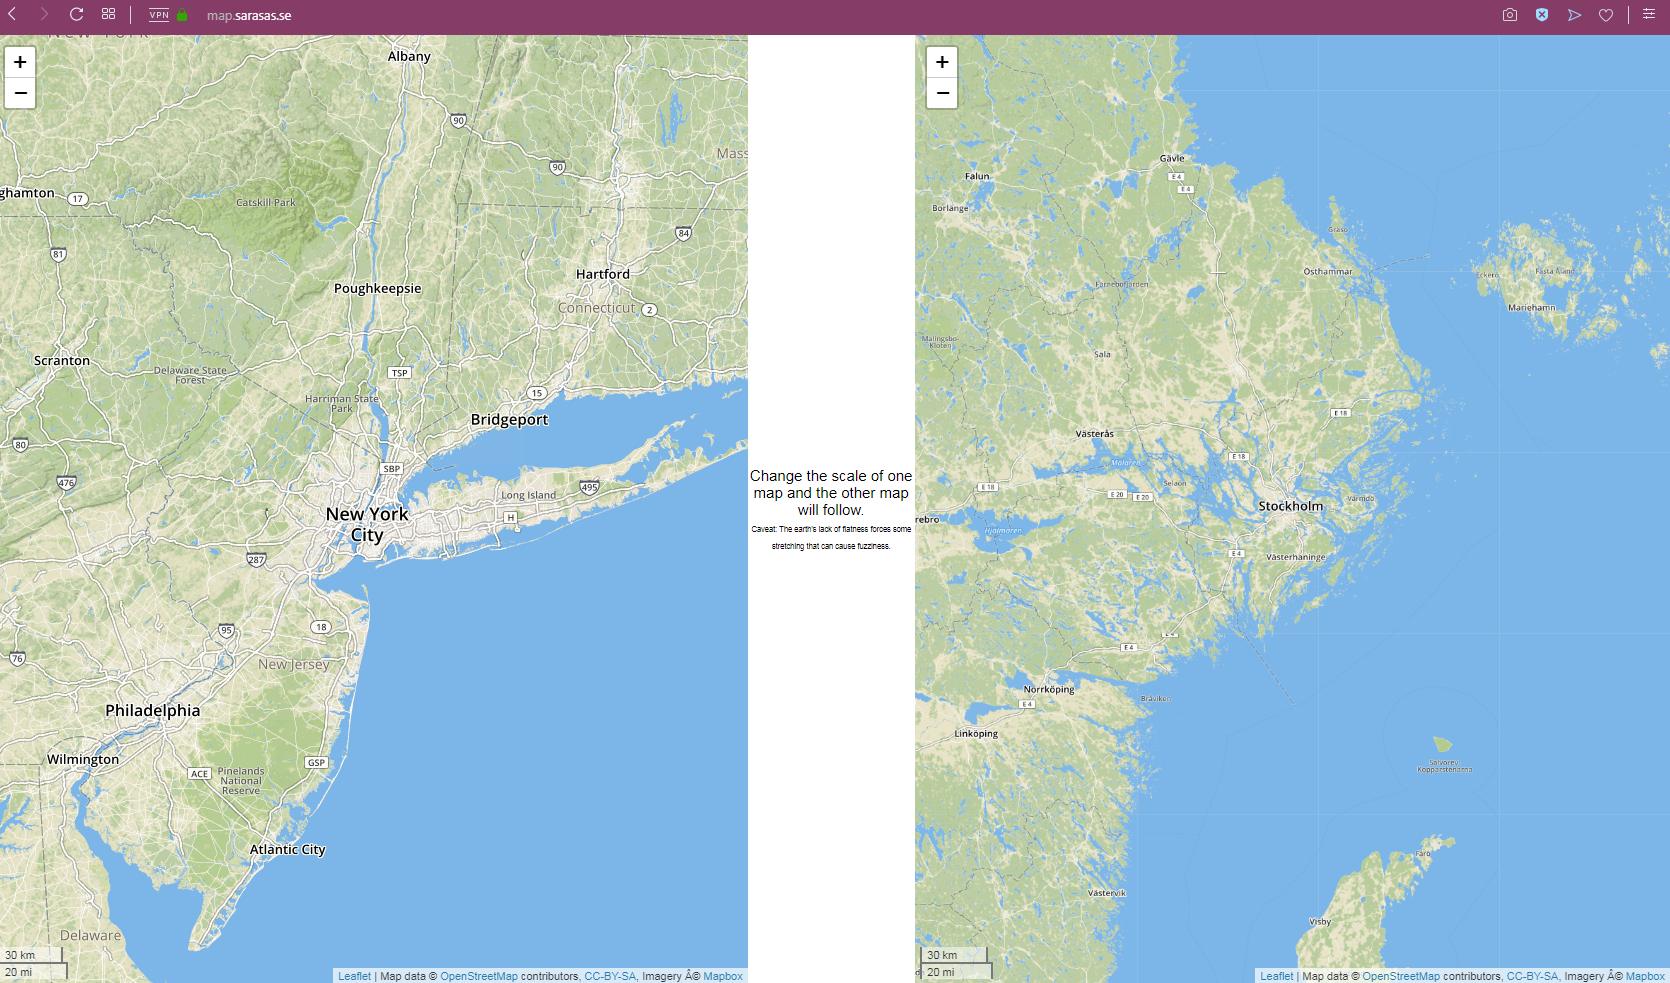
Map comparison service
